This is an ongoing project. The main objective is to build a malaria risk map for Africa using a temporal graph neural network (GNN) based on social and environmental predictors derived from satellite imagery and data.
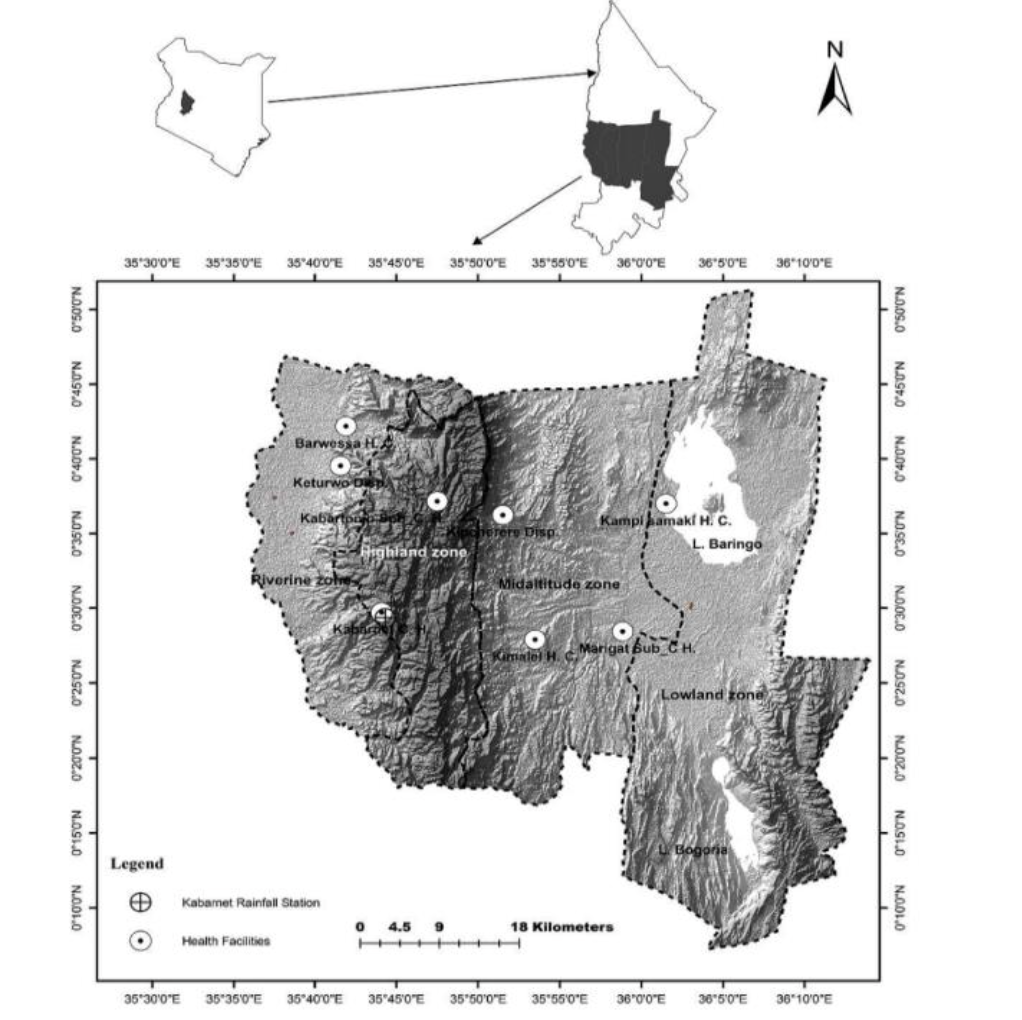
As a case study, we are currently working on Baringo county in Kenya. The county is divided into four ecological zones (Rivine, lowland, highland and midaltitude) illustrated below:
A graph network of the study area using the geocoordinates and distances between each ecological zone is illustrated below: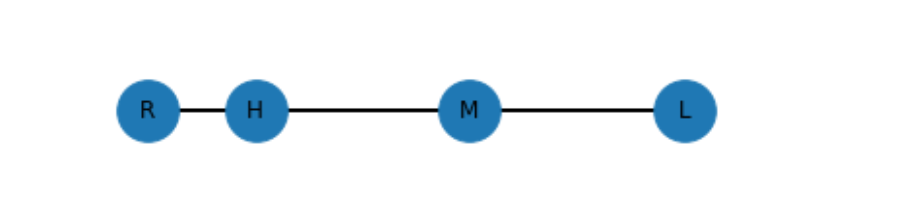
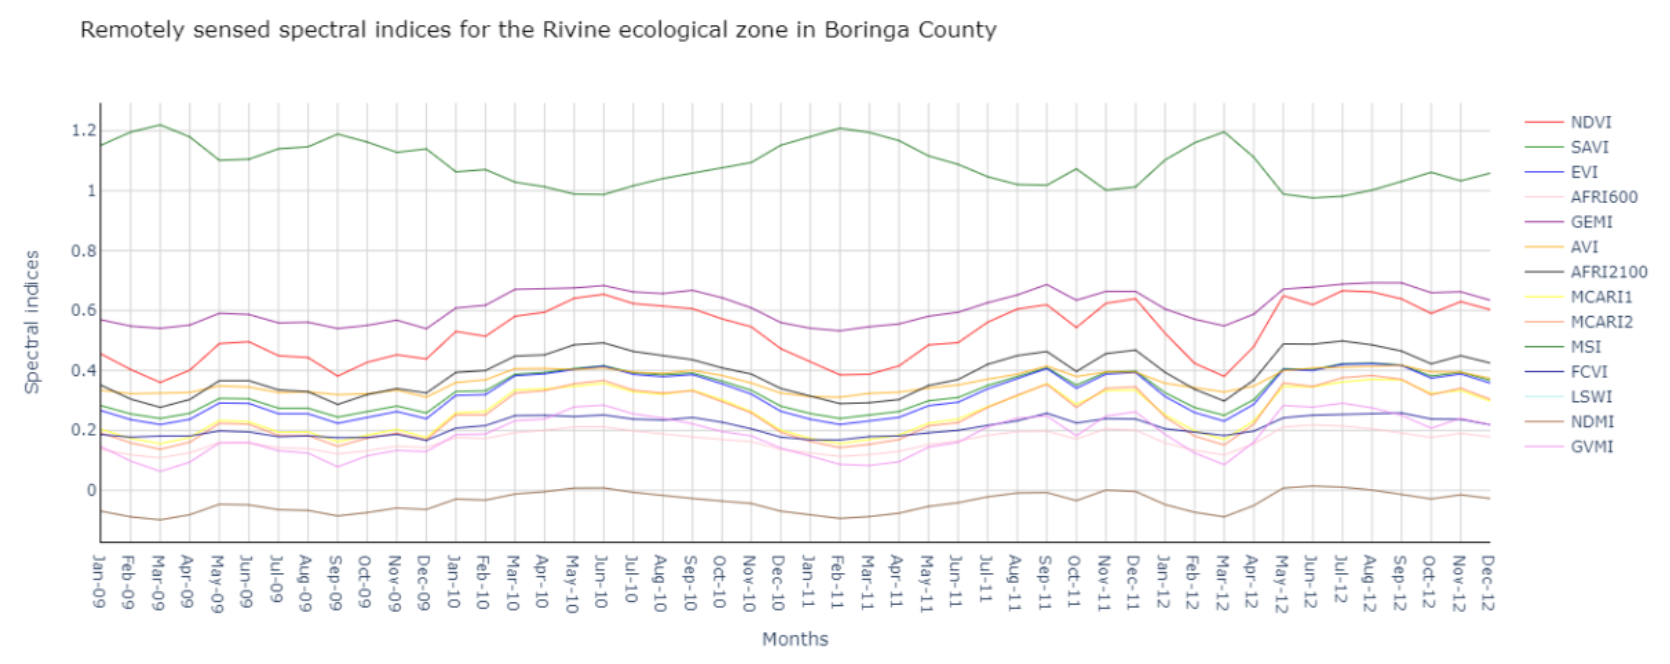
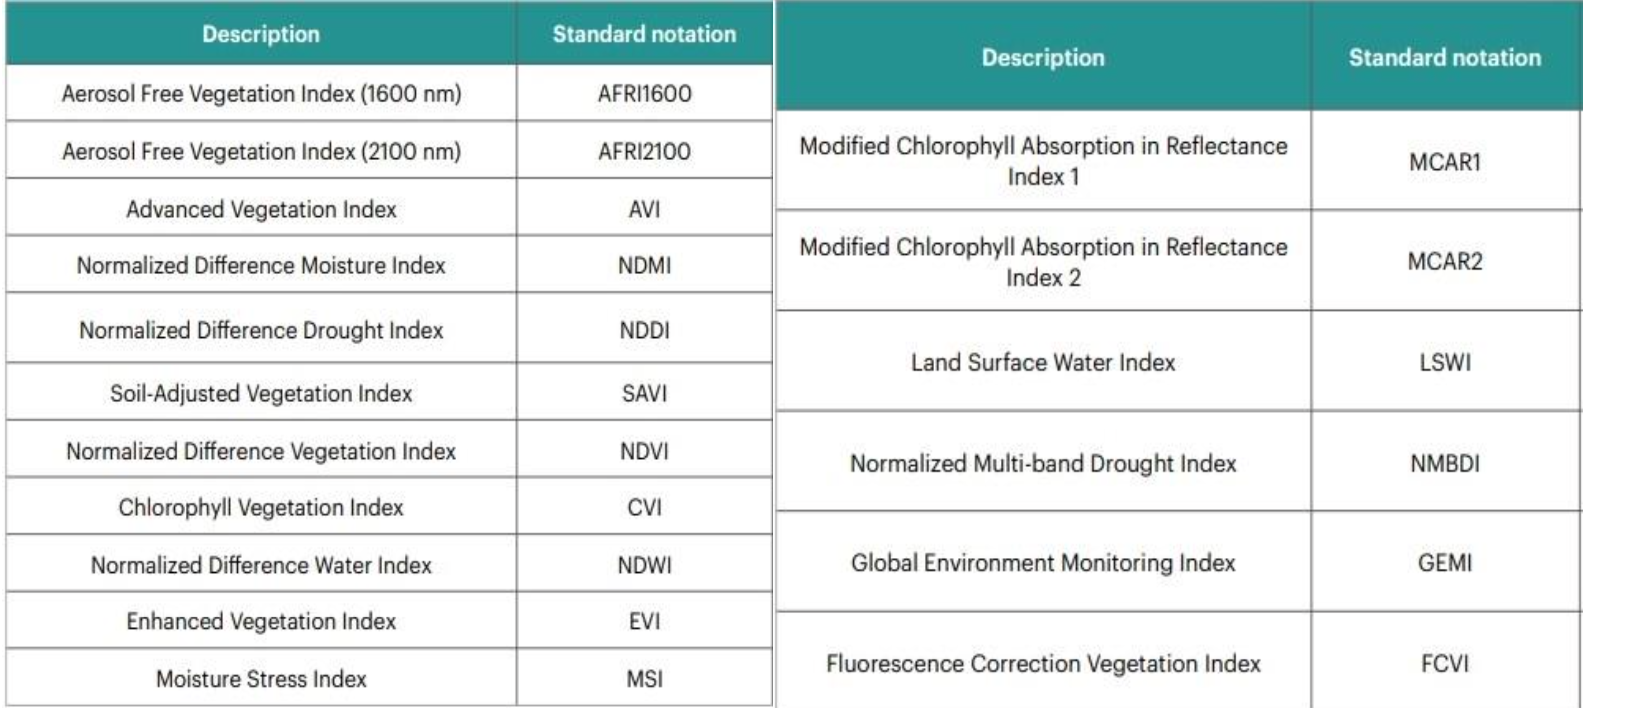
For each ecological zone, twenty-six variables are extracted from various satellites where four variables are climatic and the remaining variables are environmental or vegetation variables. MODIS Terra 8-day land surface temperature and emissivity product (MODIIA2) is used to extract the daytime, nighttime and the average land surface temperature. The total precipitation is extracted using the Integrated Multi- SatellitE Retrivals for GPM (IMERG) product version 6. The remaining twenty three indices are retrieved using the MODIS bidirectional reflectance distribution function (BRDF) adjusted surface reflectance product (MCD43B3). Some of the indices are described below:
The indices for each ecological zone are presented below. These indices are scaled ratios which change seasonally.