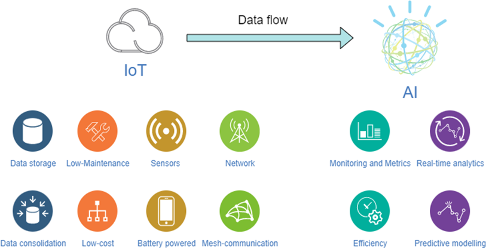
AI_r is an air quality monitoring, analysis, and prediction system. The system combines power-optimized air quality sensors with a low-cost Internet-of-Things (IoT) network architecture and Artificial Intelligence predictive capabilities (AI).
AI_r will make access to air quality monitoring and AI-powered prediction equitable by lowering the barriers to entry for developing countries.
AI_r will offer functionality suited to both developing and developed countries thereby constituting a global air quality solution.
The emerging technologies of AI and IoT have provided the ability to make decisions and predictions around public health, risk management, and governance.
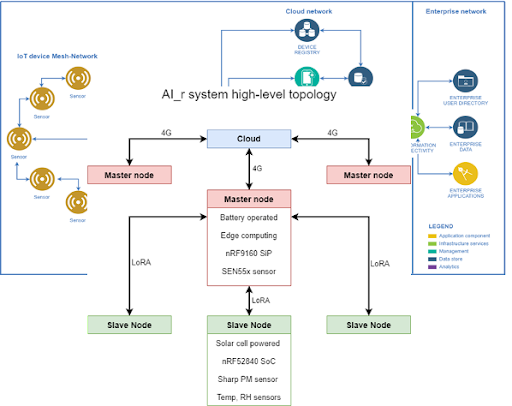
An initial high-level network topology for the AI_r system has been developed. Further refinements are expected to be made throughout the project’s duration.
A Master/Slave LoRa star communication topology has been selected. The Master air quality node provides better quality data due to the sensor suite utilized. The Master node is more costly as a result. Slave nodes were introduced to reduce the cost impact on the scalability of the system. These nodes produce poorer-quality data but allow for a more granular dataset.
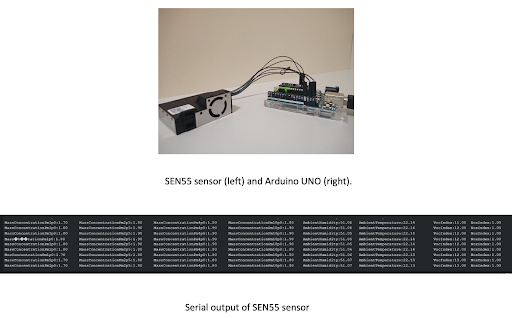
The Senserion SEN55 sensor has undergone preliminary testing with an Arduino. The results have been deemed satisfactory and therefore the porting of the sensor to the Zephyr RTOS is currently underway. The hardware setup and the resulting serial output can be observed below.
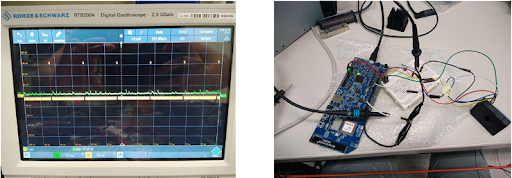
The Sharp Particulate Matter (PM) sensor requires both a pulse width modulated input as well as an Analog-to-Digital Converter to read its output. The nRF52840 SoC has the ability to fulfill both requirements. The nRF52840 SHARP PM firmware is currently being developed. The PWM signal as well as the hardware setup can be seen below.
Air Quality Monitoring Project - AI
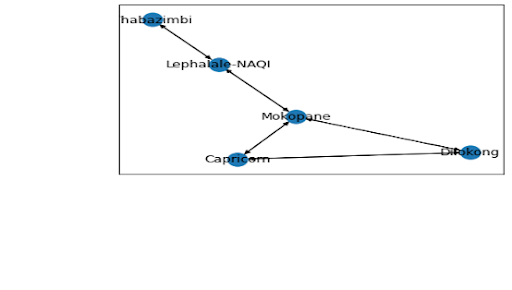
Limpopo
Graph of the air monitoring stations in Limpopo, South Africa. The shape of the graph is due to the distance threshold in this case it’s the average distance between stations (150 km). For a larger threshold, it provides a fully connected graph.
Node attributes such as Temperature, Pressure, and Rain and edge attributes such as wind speed and direction have a decisive effect on PM2.5 horizontal transport.
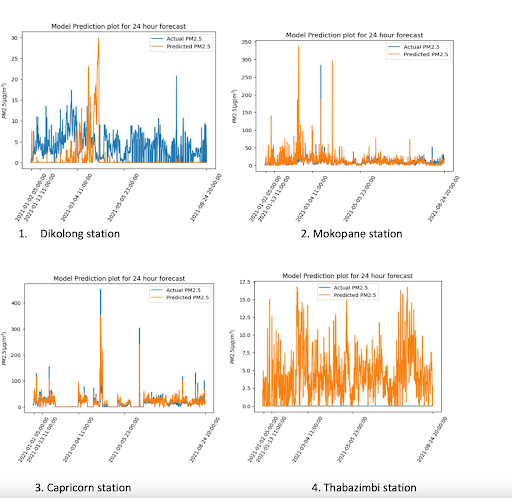
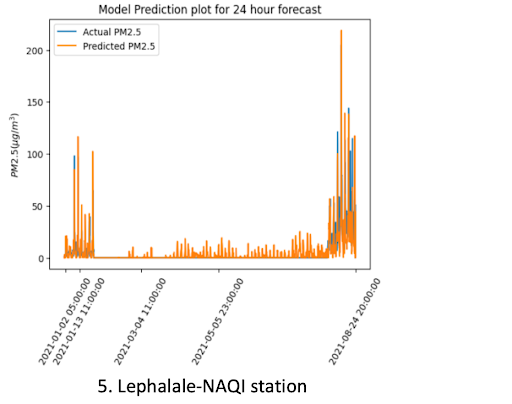
Our task was to predict the next 24 hours PM2.5 concentrations given observed PM2.5 concentrations at starting point and next 24 hours weather forecast data. The above figures show the actual PM2.5 concentrations and GNN predicted concentrations of all Limpopo stations.
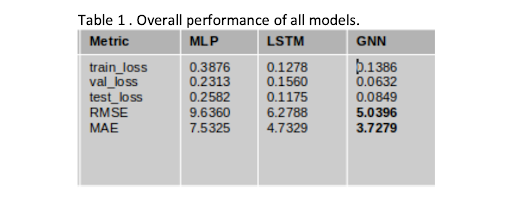
From the above table, GNN out-performed other models. The performance of GNN can be improved by adding more data and parameter tuning.
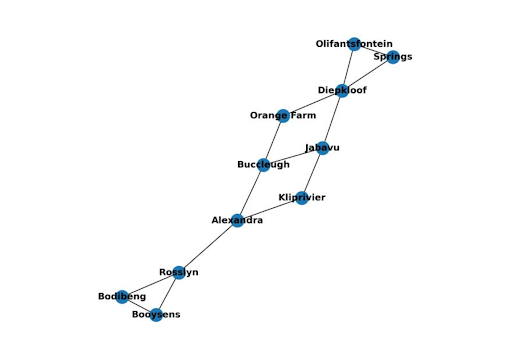
Gauteng
The prediction of air quality features is influenced by a number of factors. To improve prediction accuracy, we establish our graph by incorporating domain knowledge as attributes on nodes and edges, then learn complex underlying mechanisms and interactions between pairs of nodes based on the graph. The shape of the graph is due to the distance threshold in this case, the average distance between stations is 100 km.
Graph Convolutional Network with LSTM integrated into it was first developed, due to the univariate nature of the model, with one feature prediction. It was later dropped. A new multivariate Graph Neural Network (GNN) was implemented, with all features embedded in the model. The model considers 11 monitoring stations as nodes, 9 features embedded as node attributes, and 4 features embedded as edge attributes. To validate the effectiveness of the proposed GNN, we compare it with several models of simple multi-layer neural network (MLP), LSTM, GRU that is similar to LSTM and GC-LSTM, which integrates LSTM and Graph Convolutional Networks (GCN). Results for Gauteng stations are still pending.